Function Curves
- Function curves define pairs of values that may be used in various sorts of investigations. One can build and change Simulation curve libraries in the Function Curves dialog.
- It is recommended that utilize this box to save all of your commonly used curves to a library, so that you may use them in subsequent studies and documents more easily.

Curve Definitions
| Time Curve | Defines variation with time for nonlinear, linear dynamic and transient thermal studies. |
| Temperature Curve | Defines variation with temperature for structural and thermal studies. |
| S-N Curve | Defines fatigue properties of materials used in static studies referenced by a fatigue study. |
| Load History Curve | Defines a variable amplitude fatigue event for a fatigue study. |
| Frequency Curve | Defines variation with frequency for harmonic and random vibration linear dynamic studies. |
| Harmonic Loading Curve | Defines a harmonic load as a sum of sine and cosine functions for modal time history dynamic studies. |
To create a new Curve Library or edit an existing one:
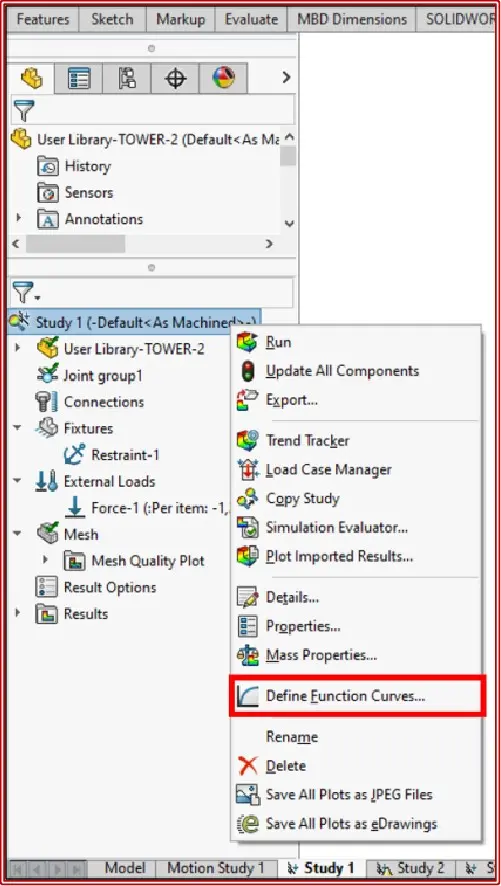
- In the Simulation study tree, right-click the study icon and select Define Function Curves.
- In the Function Curves dialog box :
a.Browse for an existing library to choose from or type in a name for a new library. (cwcur) is the extension for Simulation Curve libraries.
b.Pick one of the following actions in the Curve Library box:
- To define a time curve, right-click Time Curve and choose Create Curve.
- To define a temperature curve, right-click Temperature Curve and choose Create Curve.
- To define an S-N curve, right-click it and choose Create Curve.
- To create a load history curve that may be used to design a variable amplitude fatigue event, right-click the load history curve and choose Create Curve.
- To define variation with frequency for harmonic and random vibration linear dynamic investigations, right-click Frequency Curve and choose Create Curve.
3. Select the name of an existing curve to update or provide a name for a new curve in the Name box.
4. Do the following in the Curve Data box:
- Specify the needed units based on the curve type.
- Click File and browse to import a curve from an external text file.
- Double-click in the Points column to create a new row.
- Fill in the blanks in the X and Y cells as desired. To populate the curve, simply cut and paste.
- To delete a row, select it and press the Delete key, or right-click it and choose Delete.
5. Click View to create a graph of the curve.

(In the next blog the usage of existing curve data & saving (.CWCUR) file format will be discussed.)


